

In today’s blog post we will start to look into another common symptom; “False cadence symptoms”. This chain of symptoms is especially made to challenge the false cadence thinking with teams working in parallel within fixed time boxes of normally 2 weeks.
Asking why on “False cadence symptoms” gives these symptoms.
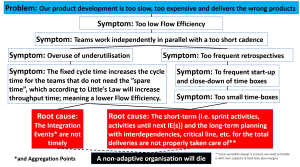
- “Overuse of underutilisation”. What is meant with that? The false cadence thinking in Agile product development comes from Lean Production, where the cycle time is 90% of the takt time, which means underutilisation. The reason for this is that Lean Production aggregates their products in every takt time, meaning an Aggregation Point* every 2-4 minutes. When a process fails with its refinement of the part it is handling within the takt time, it means problems. Therefore a 10% underutilisation has been found as the optimum to handle the processing time variability** within the processes. See also this blog post for a deep investigation about queues.
But, it is a vital difference between Lean Production and Agile Product development in this aspect, which we will see when asking why further below. - “Too frequent retrospectives”. Retrospectives is good to have, but the question is if not a retrospective every 2 weeks, is very frequent. This is also connected to the queues of activities problem in Agile product development, meaning that we need to plan the work within the sprints better, one of the root causes to Agile’s queue problems. The reason is that there will always be interdependencies between the teams and to the same SMEs (experts), and if they are not planned, we do not have control, with symptoms as a result. So, if we plan better, we will get fewer problems, which means that we can do retrospectives*** less frequent. This has been thoroughly explained in this blog post.
If we put the symptoms achieved so far in a picture structured like the Prefilled Problem Picture Analysis Map, it will look like this.

We continue to ask why on the symptom “Overuse of underutilisation”, and we get the following symptom “The fixed cycle time increases the cycle time for the teams that do not need the ”spare time”, which according to Little’s Law will increase throughput time; meaning a lower Flow Efficiency.”. And that is the big difference to Lean Production, where there is an Aggregation Point in every takt time, but here is no corresponding Integration Event at the end of the sprint. Most of the teams will be ready within the 90% of the sprint time, since it is their own estimation (and if they cannot learn their own estimation, we have organisational problems to solve), meaning they have no more planned work, the last 10%, and Little’s Law gives an increased throughput time; a decrease in Flow Efficiency.
Asking why on the symptom “Too frequent retrospectives” gives the symptom “To frequent start-up and close-down of time-boxes”, and why again gives the symptom “Too small time boxes”.
If we put the symptoms achieved so far in a picture structured like the Prefilled Problem Picture Analysis Map, it will look like this.

Asking why on the last two symptoms will give our root causes about the need of time planning, and the need of timely Integration Events.
A part of the Prefilled Problem Picture Analysis Map with the chain of symptoms for “False cadence problems” will then look like this:
The conclusion for Agile development using false cadence, especially for agile at scale, is:
- When independent teams are working in parallel in fixed time-boxes (false cadence) which do not end up in a common Integration Event, Little’s Law tells us that we will have a longer throughput time for teams finished within their estimated time (90% utilisation). This means an inefficient flow, and must be avoided.
- Also the fixed false cadence (false takt time) can be questioned, due to that the fixed time-box size can be challenged. Instead timely Integration Events should be handled, which means an Integration Event that depends on the Critical Path**** and its different contexts. To have timely Integration Events is also one of our principles.
That was all for this blog post, and in the next blog post in this series we continue with the next symptom, “We are not proactive enough to neither opportunities nor faults”. C u then.
*see the blog post Aggregation vs Integration for a thorough elaboration.
**WIP Inventories is also a margin used, to handle the variability in the part itself, machine break down in the process, tolerance problems between the parts to be added and the processed part itself, etc., see this blog post for a thorough explanation of WIP Inventories and underutilisation in Lean Production.
***we need to be very careful with retrospectives on team level, since that means suboptimising if any interactions and interdependencies to other teams and SMEs are taken into account. Measuring or fixing symptoms on team level is no different to the sub-optimising done when measuring on silo levels. Instead rather a higher level, team of teams is where retrospectives must be done. Otherwise the walk for the respective teams in the fitness landscape will be random and endless per se.
****which has been generated transdisciplinary and iteratively with the project team and its sub-teams, common experts, stakeholders, centralised resources etc., i.e. taking also resource constraints for the total organisation into account